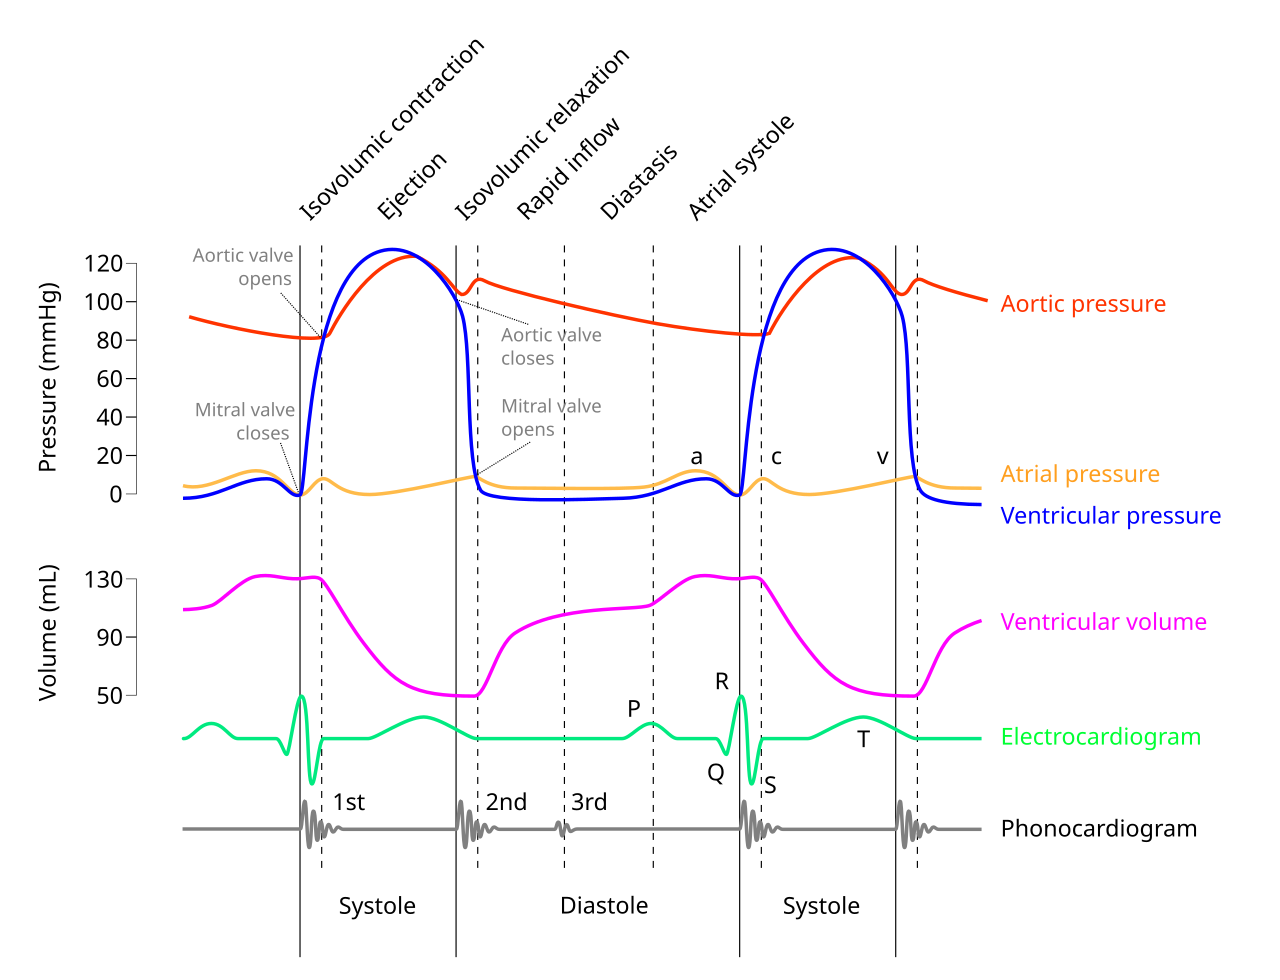
The Wiggers diagram represents simultaneous events of the cardiac cycle, with stacked graphs showing left atrial, left ventricular, and aortic pressures, heart sounds, left ventricular volume, and the electrocardiogram (ECG). It shows the pressure and volume changes within the heart chambers as well as the corresponding changes on an Electrocardiogram (ECG). The diagram uses the pressure and volume changes from the left side of the heart. The right side of the heart shows similar changes, but operates at lower pressures so the changes are not as pronounced. Therefore, for the purposes of illustration, the left side is used. The Wiggers diagram is well known as one of the most intimidating visual representations of physiological processes that students encounter in their studies.
Looking for help in understanding or explaining this complex concept? Check out this Hot Tip by Christie Jordan, BS, RDCS, RCS, RCIS, FASE, faculty for our Introduction to Adult Echocardiography training course, as she breaks down the Wiggers diagram in just over 3 minutes!
Looking for in-person training in adult echocardiography? Join us in sunny St. Petersburg for our Introduction to Adult Echo course December 4 – 8 and learn from the leading experts in Echocardiography. This 5-day course will teach you the foundational skills you need to perform echocardiography in a myriad of clinical settings. Featuring comprehensive lectures based on current ASE guidelines, interactive case interpretation, and robust hands-on skills training with a 3:1 participant to instructor ratio and standardized patient models, this course ensures you will leave feeling confident in your skills and are able to immediately integrate them into practice upon returning to your facility.
Click the link below to learn more, or give us a call at 727-363-4500. We look forward to working with you!


